This is a quick tutorial on how to create and use your very first monitor with Server Monitoring tool – a professional monitoring service for your Internet servers and services.
Step by Step
We have designed the interface of Server Monitoring with both types of users in our mind – beginners and advanced users. We will describe it for beginners here. Advanced users are recommended to read help texts on the bottom of Server Monitoring pages that fully describe the interface and all available options.
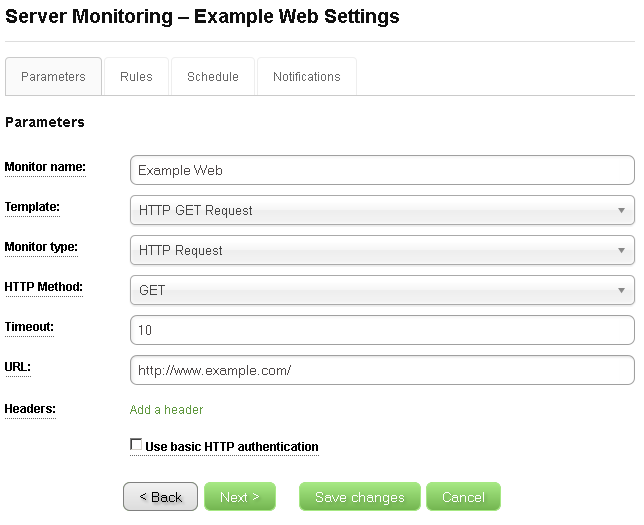
On the Create New Monitor page, you just need to enter a unique monitor’s name and a URL you want to monitor. We named our monitor Example Web and entered http://www.example.com/ as a URL.
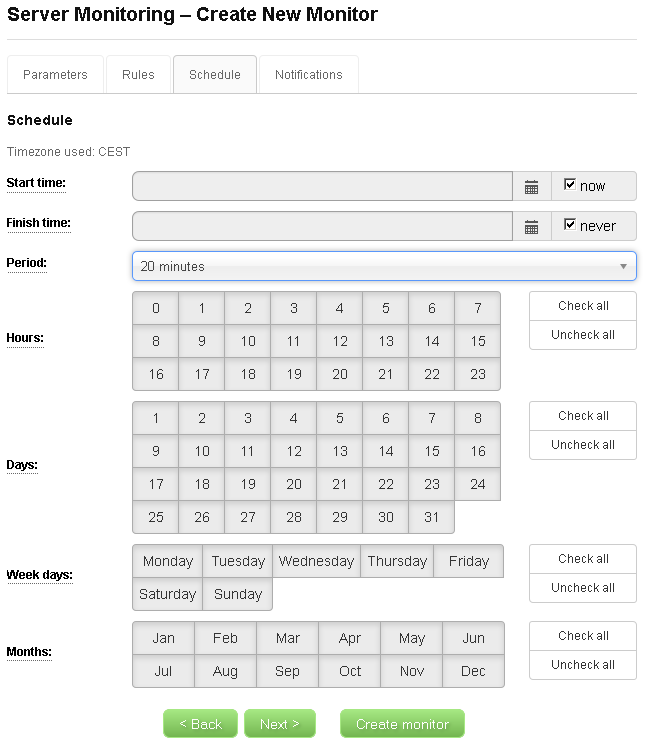
Note that you start on the Parameters tab and there are three more tabs, but you do not need to visit them or set any other value. You can just click the Create Monitor button now and it will work. In our example, however, we wanted to change the monitor’s period. This value can be found on the Schedule tab. We set the period to 20 minutes.
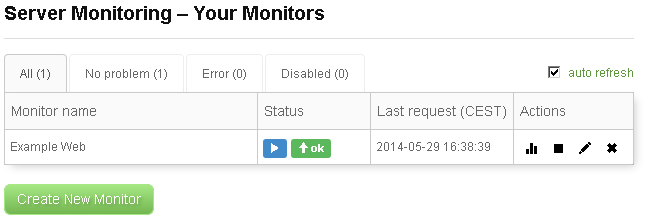
After hitting the Create Monitor button, our monitor was created and we came back to the main page with the list of our monitors.
Here you can notice that a new monitor started in a pending state. If you move your mouse over its status, as we did on the picture above, you can see that this means that the monitor was waiting for its first execution and the exact time of its next execution is provided too. Once the monitor was executed, its status changes.
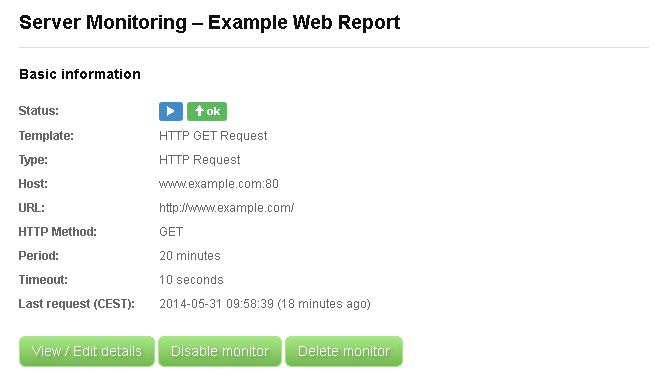
Once your monitor is running, you might be interested in looking at its report from time to time. Simply click the first icon in the Actions column to get to the monitor’s report page. The report page consists of several sections:
- Basic information – A brief summary of the most important settings of the monitor is displayed here. Control buttons allows you to perform basic operations with the monitor.
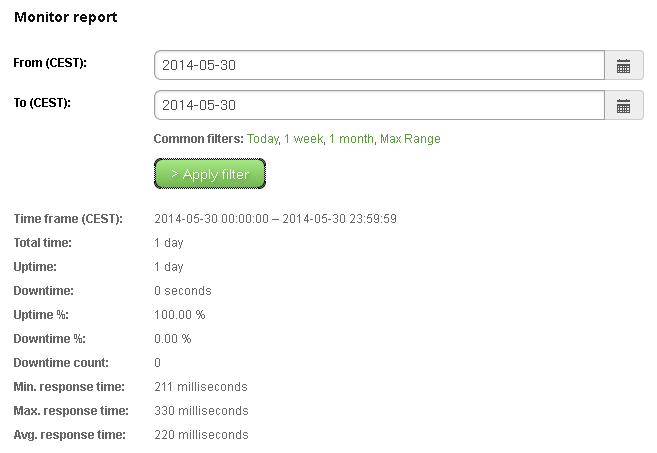
- Monitor report – Here you specify the time frame that you want to work with. The Apply filter button loads the data for the given time frame and all the information below this form are then relevant to the specified time frame. Basic monitor statistics are displayed below the form.
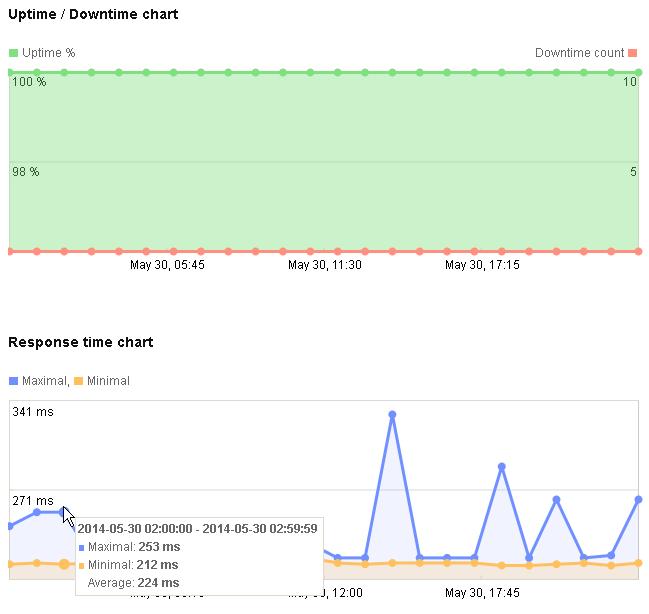
- Uptime / Downtime chart and Response time chart – Two charts that give you quick information about the state of the server you monitor. The green color in the Uptime / Downtime chart shows the Uptime % statistics in time, the red line is related to the number of downtimes. The Response time chart displays a maximal (blue points) and a minimal (ochre color) response times of the monitored server to the monitor. In both charts, you can move your mouse over the chart nodes to see the node data.
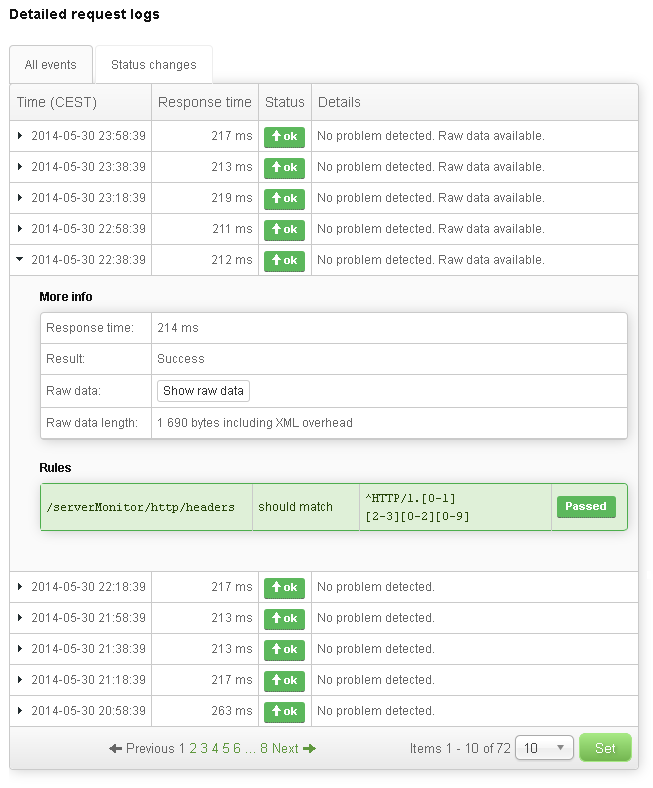
- Detailed request logs – A table of monitor events with descriptions and additional data. There are two modes to display the events. In the All events tab, you can simply see all the monitor events. However, the number of events can be very large, so this may not always be the easiest way to find what you are looking for. This is where Status changes tab helps. It displays only those events that changed the monitor’s status. For example, if the monitored server was doing OK and then it went down for a few minutes and then got back up again, only the first error event and the first OK event after the recovery will be displayed in the Status changes tab. Note that if a table row starts with a small black arrow, you can click it and thus access additional event data.

