This article is an introduction to our new Server Monitoring tool – a professional monitoring service for your Internet servers and services. And we also write a few words about how we accept Bitcoin.
The Bitcoin Part
Let’s start with Bitcoin. With the Online Domain Tools 2.0 upgrade, you can now register a user account in our system and either use our services for free as before, or buy additional credits to your account and use it more extensively (for more on this topic, see below). And credits can be bought via PayPal, bank wire transfer, or Bitcoin – a relatively new technology, with many cool features, that can be used for online payments. If you never heard of Bitcoin, which is not very likely for a typical Online Domain Tools user, we recommend you to spend some time to read about it. It is a very interesting payment network and a technology platform.
Credits are universal in Online Domain Tools, this means that they can be used to pay for any kind of service we provide, including Server Monitoring. The pricing of operations in Online Domain Tools was designed to suit all kinds of users, from unregistered visitors that just want to try something quickly for free, to professionals who are happy to pay to get high quality services. How this works is well described on the Pricing page.
So, how do we work with Bitcoin in our system? Our subscriptions and credit packages are priced primarily in USD. Using current currency rates, we calculate prices for other currencies that we currently support. We count our Bitcoin rates from rates statistics provided by Bitstamp, one of the largest and most stable Bitcoin market. We have decided to start with our own implementation that works with Blockchain.info API, and not to use any online Bitcoin payment provider, such as BitPay. Such an approach allows us to have no fees for accepting bitcoins. Moreover, as we support the ideas behind Bitcoin, we offer 10 % discount for all orders paid by bitcoins with this coupon: ODT-10-OFF-BTC.
We simply want to be one of the first service providers that offer high quality online server monitoring for bitcoins.
Online Server Monitoring Service
All tools in Online Domain Tools come with documentation that is placed below a tool’s interface, at the bottom of its page. This holds for Server Monitoring too and we recommend you to read those instructions whenever you are not sure about how to use any part of the Server Monitoring interface. Here, we will provide a slightly different look at our Server Monitoring tool.
Pricing
How much will you pay for our monitoring service? It depends on how you set up your monitors. Our pricing starts with zero – see Free Monitoring below! But let’s assume here that you want to maintain a higher number of very frequent monitors. How much will you pay then?
For paid monitoring services, we recommend to purchase one of our subscriptions. Following pricing assumes you buy a subscription for 1 year.
- Subscription Type A – You pay 13.25 USD and get +100 daily credits and 250 credits to your wallet for each month of subscription. In total you will have up to 103.20 daily credits, depending on your settings. Since each 1 minute monitor costs ¢6.00, you will be able to run 17 monitors with 1 minute period. Your cost for 1 minute monitor will be just 0.78 USD. And with 250 credits per month and a price of ¢4.00, you will be able to receive more than 60 SMS alerts when any of your monitored servers gets down or back up again.
- Subscription Type B – With this smaller subscription, you get +20 daily credits and 60 credits to your wallet for each month of subscription. Here we assume, you are OK with 5 minutes monitoring period, which cost ¢1.50 each. You can have up to 15 of these monitors and 15 SMS alerts per month. The price of this subscription is 5.31 USD per month, which makes your cost for a single 5 minute monitor only about 0.35 USD.
- Subscription Type C – This is our smallest subscription package, but it is very cheap. It is available for as low as 2.63 USD per month and gives you +5 daily credits and 20 credits to your wallet for each month of your subscription. With this single subscription your daily credit limit will be up to 8.20, which is enough to pay for 7 monitors with 10 minutes period (¢1.10 each). 20 extra credits per month are enough for 5 SMS alerts. Your cost for a single 10 minutes monitor is about 0.38 USD with this subscription.
Obviously, if you do not create as many monitors as you can, you will have many credits left, these can be used for sending SMS alerts or you can use them to pay for running other tools. Note that you can buy more than one subscription at a time. So, if you need to monitor 7 servers with 1 minute period, you do not need to buy subscription Type A. You can buy two subscriptions Type B for lower price.
Free Monitoring?
Yes, we do offer free Server Monitoring too. You need to be a registered user to use Server Monitoring tool, but you do not need to pay anything to use it or to try it, if you do not want to. As it is described on the Pricing page, the maximum number of daily credits a non-paying user can obtain is 2.20. With this amount of credits, you can afford to create:
- one 5 minute monitor (¢1.50), or
- two 10 minutes monitors (2 * ¢1.10), or
- two 15 minutes monitors and one 20 minutes monitor (2 * ¢0.80 + ¢0.60), or
- four 30 minutes monitors and one 1 hour monitor (4 * ¢0.45 + ¢0.30), or
- even more monitors with higher periods.
If you are an owner of just one or two web sites and if you do not need an immediate alert within one minute after an incident happen, this is probably all you need. And you can have it for free with our Server Monitoring tool.
Easy-to-use Interface
We have designed the interface of Server Monitoring with both types of users in our mind – beginners and advanced users. We will start with an example for beginners. This is how you can quickly create a web site monitor with just a few clicks.
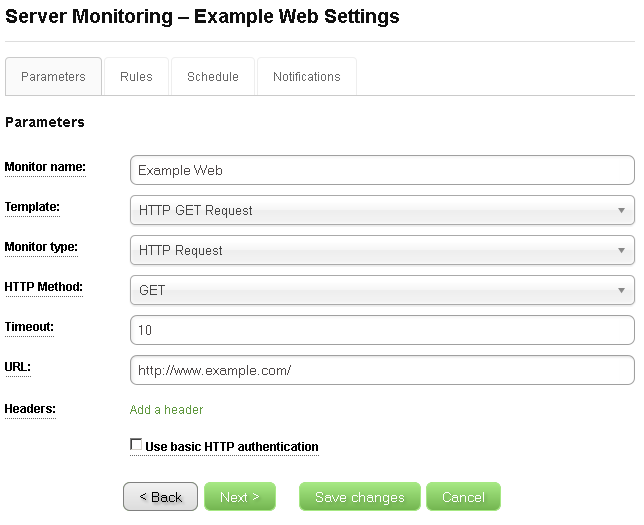
On the Create New Monitor page, you just need to enter a unique monitor’s name and a URL you want to monitor. We named our monitor Example Web and entered http://www.example.com/ as a URL.
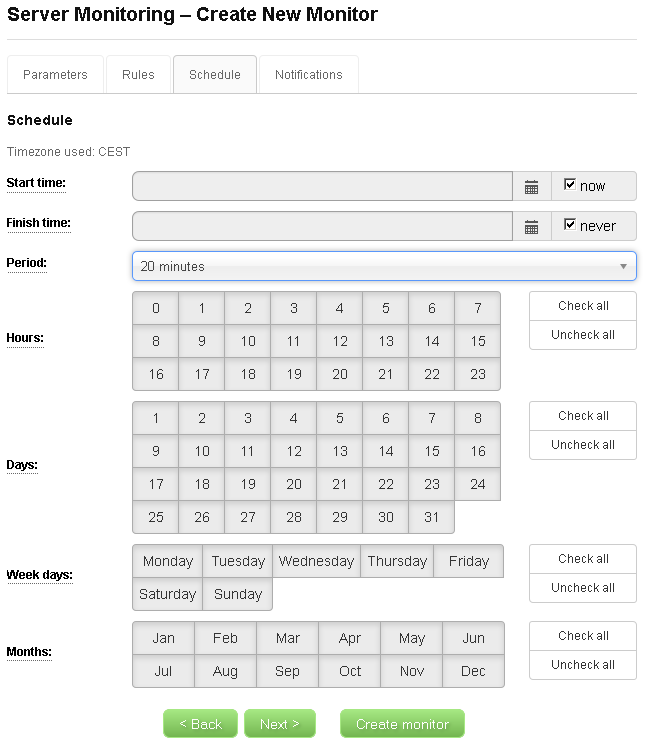
Note that you start on the Parameters tab and there are three more tabs, but you do not need to visit them or set any other value. You can just click the Create Monitor button now and it will work. In our example, however, we wanted to change the monitor’s period. This value can be found on the Schedule tab. We set the period to 20 minutes.
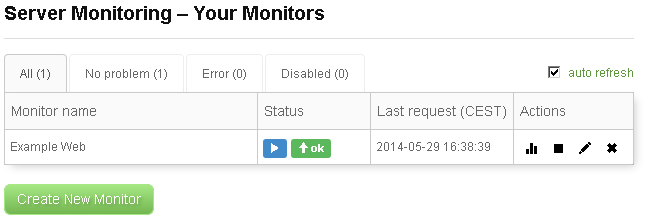
After hitting the Create Monitor button, our monitor was created and we came back to the main page with the list of our monitors.
Here you can notice that a new monitor started in a pending state. If you move your mouse over its status, as we did on the picture above, you can see that this means that the monitor was waiting for its first execution and the exact time of its next execution is provided too. Once the monitor was executed, its status changes.
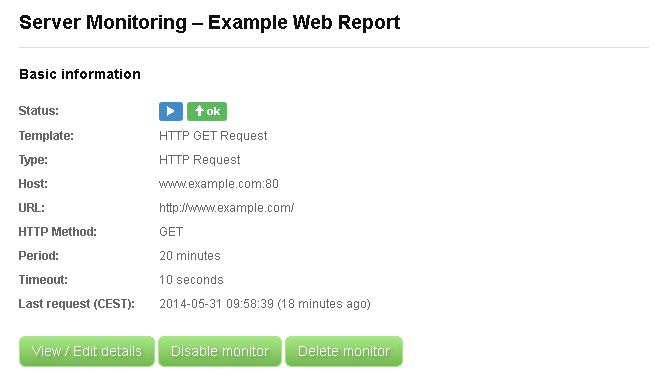
Once your monitor is running, you might be interested in looking at its report from time to time. Simply click the first icon in the Actions column to get to the monitor’s report page. The report page consists of several sections:
- Basic information – A brief summary of the most important settings of the monitor is displayed here. Control buttons allows you to perform basic operations with the monitor.
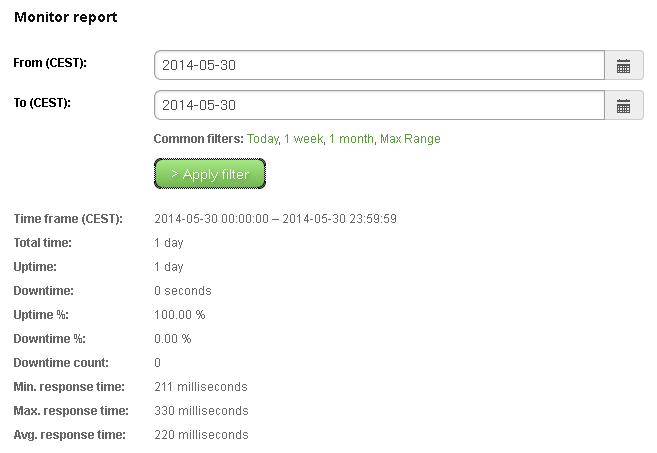
- Monitor report – Here you specify the time frame that you want to work with. The Apply filter button loads the data for the given time frame and all the information below this form are then relevant to the specified time frame. Basic monitor statistics are displayed below the form.
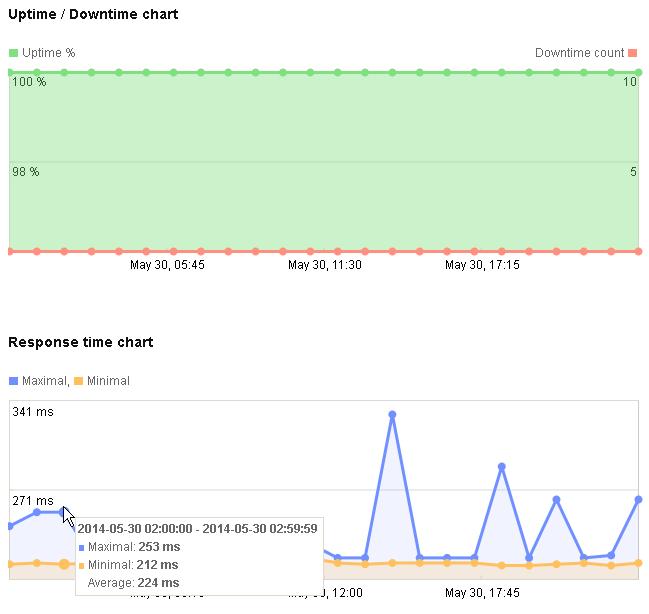
- Uptime / Downtime chart and Response time chart – Two charts that give you quick information about the state of the server you monitor. The green color in the Uptime / Downtime chart shows the Uptime % statistics in time, the red line is related to the number of downtimes. The Response time chart displays a maximal (blue points) and a minimal (ochre color) response times of the monitored server to the monitor. In both charts, you can move your mouse over the chart nodes to see the node data.
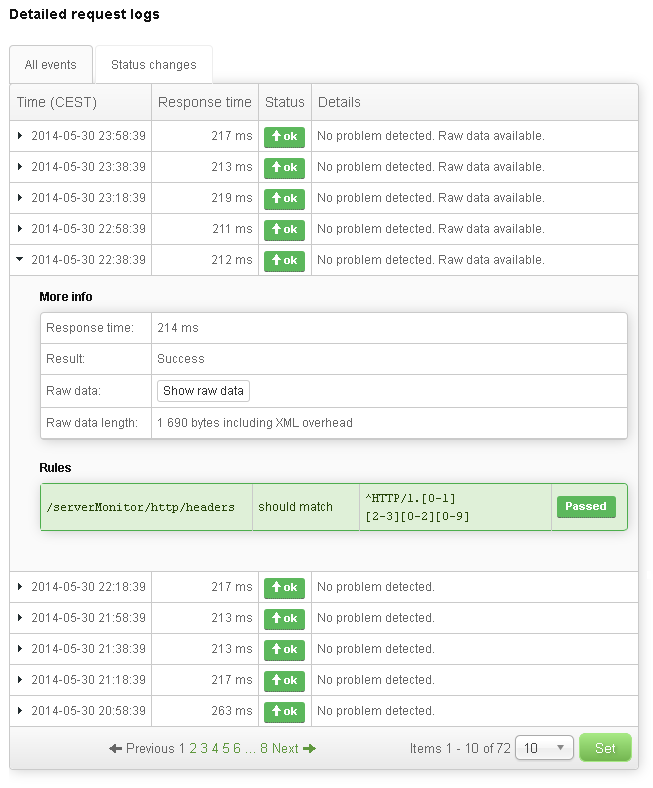
- Detailed request logs – A table of monitor events with descriptions and additional data. There are two modes to display the events. In the All events tab, you can simply see all the monitor events. However, the number of events can be very large, so this may not always be the easiest way to find what you are looking for. This is where Status changes tab helps. It displays only those events that changed the monitor’s status. For example, if the monitored server was doing OK and then it went down for a few minutes and then got back up again, only the first error event and the first OK event after the recovery will be displayed in the Status changes tab. Note that if a table row starts with a small black arrow, you can click it and thus access additional event data.
Advanced Features
Most of the users will probably want to monitor their web sites, but that is only a small part of what Server Monitoring offers. Besides HTTP GET/HEAD/POST requests, you can monitor server responsiveness to ICMP ECHO requests, monitor whether a particular TCP port is open, whether a TCP or a UDP server reacts as it should on specific requests. SSL support for TCP monitors is also included. We have implemented templates to make it easy for you to monitor FTP servers, SMTP and POP3 servers, IMAP servers, or SSH servers.
Advanced users may benefit from a complex system of rules that can be used to check whether a response matches given regular expressions. Basic users can use much simpler Basic mode to define these rules.
For each monitor, you can set up its calendar, which means to define in which hours, days, and months it is allowed or disallowed to execute.
Finally, there is a simple system of notifications that serve for two purposes. The first one is to send alerts when a monitor is down or recovers from downtime. The second role is to send periodical reports about the monitor to users. Alerts can be sent to any notification contact of any user who is a member of the account under which the monitor was created. Reports can only be sent to email contacts.
Much more would have to be written in order to describe all features of our server monitoring service. The introduction provided above should be good enough for most users to get the overall picture of it and start using it. And we will be glad if you do.

